Harnessing Data Visualization in Email Marketing: Turning Numbers into Narratives
Email marketing has never been more competitive. With over 347 billion emails sent and received every day in 2023, getting recipients to actually read and engage with your messages is a true challenge. Standing out in the inbox requires more than clever copy and eye-catching colors—modern marketers are discovering the power of data visualization to transform dry statistics into compelling stories that drive action. This article explores how data visualization can elevate your email marketing strategy, offering fresh insights and practical methods for marketers and creators eager to leverage numbers in a visually impactful way.
What Is Data Visualization in Email Marketing?
Data visualization is the practice of presenting data in graphical or pictorial formats—think charts, graphs, maps, and diagrams. In the context of email marketing, data visualization enables brands to communicate complex information quickly and clearly, turning raw numbers into stories that resonate.
Instead of presenting recipients with a wall of statistics or paragraphs of analysis, marketers can use visual tools to:
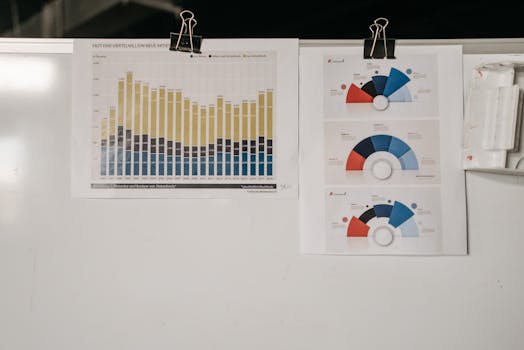
.png) - Highlight trends and progress (e.g., line graphs showing customer growth)
- Compare metrics (e.g., bar charts of product sales)
- Showcase survey results or customer feedback
- Break down complex processes or timelines
- Highlight trends and progress (e.g., line graphs showing customer growth)
- Compare metrics (e.g., bar charts of product sales)
- Showcase survey results or customer feedback
- Break down complex processes or timelines
According to a 2022 Content Marketing Institute study, emails that include relevant visuals experience a 37% higher click-through rate than those that rely on text alone. This isn’t surprising: the human brain processes visuals 60,000 times faster than text, and visual content boosts retention rates by up to 42%.
Why Numbers Need Stories: The Psychology Behind Visual Data
Marketers know that numbers are persuasive—but only when they’re understood. The challenge is that most people are “visual learners”: 65% of the population processes information best through images. When presented with text-heavy statistics, readers often skim or disengage.
Data visualization bridges this gap by:
- Simplifying complicated data sets - Making trends and patterns instantly recognizable - Engaging both the analytical and emotional sides of the brainFor example, a pie chart showing that "72% of subscribers prefer mobile-friendly emails" sticks in memory much longer than the same fact listed in a sentence. This is anchored in neuroscience: visuals activate the brain’s visual cortex, which is responsible for both memory and attention.
Types of Data Visualizations That Shine in Email
Not all data visualizations are created equal—especially in the confines of an email. The best visualizations are clear, mobile-friendly, and directly tied to your message. Here are some top-performing formats:
| Type | Best For | Example Use | Design Tip |
|---|---|---|---|
| Bar Chart | Comparing quantities | Year-over-year sales | Limit categories to 3–5 for clarity |
| Pie Chart | Showing proportions | Customer segment breakdown | Highlight key segment in bold color |
| Line Graph | Visualizing trends over time | Monthly website traffic | Keep lines simple, avoid clutter |
| Heat Map | Spotting patterns or density | Email open rates by region | Use intuitive color gradients |
| Icon Array | Illustrating percentages | 80% satisfaction rate | Represent each 10% with an icon |
A 2023 Litmus report found that emails with simple bar or line charts had a 28% higher engagement rate compared to those with more complex or cluttered visuals. The takeaway: clarity trumps complexity.
Best Practices for Integrating Data Visualizations in Emails
While it’s tempting to pack your emails with colorful charts, effective data visualization follows several best practices:
1. $1: Use one main visualization per email (or section), and avoid using multiple chart types at once. Overloading readers with graphics can cause confusion and diminish impact. 2. $1: Ensure your visuals are readable on both desktop and mobile devices. Use sufficiently large labels, high-contrast colors, and alt-text so screen readers can interpret them. 3. $1: Every chart or graph should have a clear takeaway. Don’t just show data—explain what it means and why it matters to your audience. 4. $1: Match colors, fonts, and design styles to your brand for a cohesive look. Custom icons or branded color palettes can make visuals feel unique and recognizable. 5. $1: Visuals should load fast. Use compressed PNGs or SVGs to keep email size under 100KB per image, ensuring deliverability and mobile performance. 6. $1: While true interactivity is limited in most email clients, simple GIF animations or clickable sections can add engagement without breaking compatibility.Case Study: How a SaaS Company Increased Engagement with Data Visual Emails
Consider the example of FinTech SaaS provider “Budgetly.” In their monthly product update emails, they once listed new features and user adoption stats in bullet points. Open rates were average, but click-through rates lagged at 2.1%.
In Q3 2023, they revamped their approach:
- Replaced dense statistics with a simple line graph showing month-over-month user growth - Used a pie chart to visualize feature adoption, highlighting the most popular new tool - Added a single call-to-action (“See How You Compare”) linked to a personalized dashboardThe results were immediate:
- Click-through rate jumped to 3.9%—an 86% increase - Average read time rose by 42% - Positive replies and feedback doubledBudgetly’s experience shows that when data is clear and visual, it’s more likely to inspire action.
Measuring the Impact: Analytics for Data-Driven Visual Emails
To know if your data visualizations are working, track these key metrics:
- $1 Are more users clicking your calls-to-action after viewing the visualization? - $1 Are recipients spending longer engaging with your content? - $1 Some email platforms allow you to see where users click within your email—use this to refine placement and design. - $1 Send versions with and without visualizations to measure the difference in performance. For example, Campaign Monitor found that adding a data-driven graphic boosted their newsletter’s CTR by 21% over text-only variants.Additionally, monitor feedback and replies. Are readers commenting on or sharing your visuals? Do they forward your emails more frequently? These qualitative signals can be just as valuable as the numbers.
Tools for Creating Data Visualizations for Email Marketers
You don’t need to be a graphic designer to create compelling visual data for your emails. Here are some popular tools:
| Tool | Type | Best For | Notable Features |
|---|---|---|---|
| Canva | Web app | Quick infographics and charts | Customizable templates, drag-and-drop |
| Piktochart | Web app | Infographics, reports, charts | Data import, brand kits |
| Google Charts | Web API | Dynamic, embeddable charts | Free, programmable, interactive |
| Venngage | Web app | Infographics, charts, reports | Team collaboration, extensive templates |
| Flourish | Web app | Advanced, interactive charts | Animated visualizations, map support |
Most of these tools allow export in image formats ideal for embedding in emails, ensuring compatibility across devices and email clients.
Final Thoughts: Transforming Email Marketing with Visualized Data
In a world where inboxes are overflowing and attention spans are shrinking, data visualization is a secret weapon for marketers and creators. By transforming raw numbers into visual stories, you can boost engagement, drive action, and make your messages memorable. Whether you’re sharing performance updates, customer testimonials, or industry insights, the right visual can turn information into inspiration. The next time you plan an email campaign, ask yourself: how can I show this, not just tell it?