The Science Behind Visual Email Newsletters: How Cognitive Psychology Shapes Engagement
Email marketing has become a staple for brands, creators, and marketers seeking to build authentic connections with their audiences. But with inboxes flooded by hundreds of emails each day—Statista estimated that 347.3 billion emails were sent and received daily in 2023—standing out is more challenging than ever. While tips about using visuals, infographics, and storytelling are abundant, few resources dive into the science of $1 these tactics work. In this article, we explore how cognitive psychology underpins the effectiveness of visual email newsletters, and how marketers can apply these insights to create more memorable, persuasive campaigns.
Understanding the Brain’s Response to Visuals in Email
The human brain processes visual information remarkably fast—research from MIT found that people can identify images seen for as little as 13 milliseconds. This rapid processing gives visuals a distinct advantage over text-based content in email marketing. When a recipient opens an email, their brain immediately scans for visual cues, which determine if they’ll keep reading or move on.
Cognitive Load Theory tells us that the brain has a limited capacity for processing information at any one time. Well-designed visuals help lighten the "cognitive load" by breaking up text and guiding the reader’s focus. For example, emails with prominent images or infographics can improve recall by up to 65% three days later, compared to just 10% for text-only messages (according to a study by Brain Rules).
.png)
Furthermore, color psychology plays a vital role in email engagement. A 2021 HubSpot study reported that using a colored call-to-action button can increase click-through rates by up to 21%. When marketers understand how the brain reacts to visual stimuli, they can design emails that not only grab attention, but also encourage action.
Visual Hierarchy: Guiding the Reader’s Eye
Visual hierarchy is a psychological principle that prioritizes elements in a design based on their importance. This approach leverages size, color, contrast, and placement to guide readers through an email in a logical sequence—critical in email marketing, where attention spans average just 8 seconds.
The F-shaped reading pattern, discovered by Nielsen Norman Group, reveals that readers scan screens in an F-shape: starting at the top, moving horizontally, then down the left side, with shorter horizontal movements. Marketers can exploit this by placing key information—such as headlines, offers, and calls to action—along these visual "hot spots."
Effective visual hierarchy helps:
- Increase conversion rates by up to 30% (Crazy Egg, 2022) - Improve readability, making complex data or stories easier to digest - Reinforce brand identity through consistent use of visual elementsA well-structured email design doesn’t just look attractive—it aligns with how the brain naturally processes information.
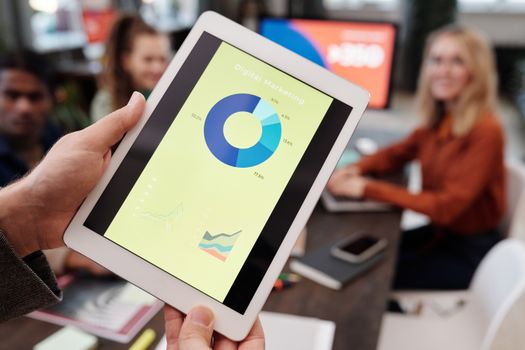
Data Visualization: Turning Numbers into Narratives
Marketers often rely on data to persuade or inform, but raw numbers can overwhelm or bore recipients. That’s where data visualization comes in—a practice rooted in cognitive psychology. The Picture Superiority Effect shows that people remember pictures far better than words; combining the two can boost retention to almost 65% (John Medina, Brain Rules).
Infographics, charts, and other visual representations help:
- Simplify complex statistics, making them more accessible - Highlight trends or key takeaways at a glance - Evoke emotional responses that drive engagementFor example, a SaaS company might use a bar chart in an email newsletter to illustrate 30% year-over-year growth, making the achievement tangible and memorable. A survey by Venngage found that 49% of marketers rate visual content as "very important" to their strategies, with infographics cited as one of the most effective formats.
| Element | Retention Rate After 3 Days | Engagement Impact |
|---|---|---|
| Text Only | 10% | Low |
| Visuals Only | 35% | Moderate |
| Text + Visuals | 65% | High |
Storytelling with Visual Cues: The Psychology of Narrative Flow
Humans are wired for stories, and visual cues can make narratives in emails even more powerful. According to Paul Zak, a neuroscientist at Claremont Graduate University, stories that evoke emotion trigger the release of oxytocin, which increases trust and empathy. When combined with visuals—such as sequential images, timelines, or illustrated characters—story-driven emails can see open rates up to 29% higher than non-narrative emails (Campaign Monitor, 2022).
Key psychological principles at play include:
- The Primacy Effect: Readers remember the first elements they see, making the visual "lead" crucial. - The Recency Effect: The last thing a reader sees (often a closing image or call to action) lingers in memory. - Emotional Contagion: Visuals expressing emotions can cause viewers to "mirror" those feelings, making them more receptive to messages.For creators and marketers, this means a thoughtfully illustrated story or branded comic strip could be more persuasive than a list of product benefits.
Accessibility and Inclusivity: Designing for Every Brain
Applying cognitive psychology to email design isn’t just about boosting engagement—it’s also about inclusivity. An estimated 2.2 billion people globally have visual impairments (World Health Organization, 2021). To ensure all readers benefit from visual content, marketers should:
- Use alt text for all visual elements, making emails accessible to screen readers - Choose high-contrast color schemes for readability - Avoid color combinations problematic for color blindness (such as red-green) - Include data labels and captions on charts and infographicsAccessible design isn’t just good ethics—it expands your reach and complies with regulations like the Americans with Disabilities Act (ADA) and the EU’s Web Accessibility Directive.
Real-World Success: Case Studies in Visual Email Psychology
Let’s look at two brands using cognitive psychology to drive email engagement:
1. $1 Their onboarding emails feature bold illustrations guiding users through setup steps. By leveraging visual hierarchy and color psychology, Dropbox increased user activation rates by 20% in their first month of a redesigned campaign. 2. $1 This nonprofit uses storytelling-infused visuals and data-driven infographics in donor emails. Combining emotional photography with clean charts, they achieved a 25% increase in donor retention over a year.These examples show that understanding the science of visuals can yield measurable business results.
Conclusion
Visual email newsletters succeed not just because they look good, but because they align with how the human brain processes, retains, and acts on information. By applying principles from cognitive psychology—like visual hierarchy, data visualization, storytelling cues, and accessibility—marketers and creators can craft emails that stand out in crowded inboxes and drive real engagement. As digital communication continues to evolve, those who leverage the science behind visual design will be best positioned to build meaningful, lasting connections with their audiences.